The Finger Lakes enters the 2026-27 winter with a stronger signal for above-normal temperatures than for a wetter or drier season, as a strengthening El Niño helps shape the national forecast.

The Climate Prediction Center's December–February outlook, issued Oct. 15, places the region within a broad area with a 50% to 60% chance of above-normal seasonal temperatures. Its precipitation map shows a transition across New York, from equal chances in the west toward a modest wetter-than-normal tilt farther east.

That leaves residents with two different messages: a favored warmer average over the three months, but no single wet-or-dry forecast that fits all of the Finger Lakes. Neither map supplies a snowfall total for the coming winter.
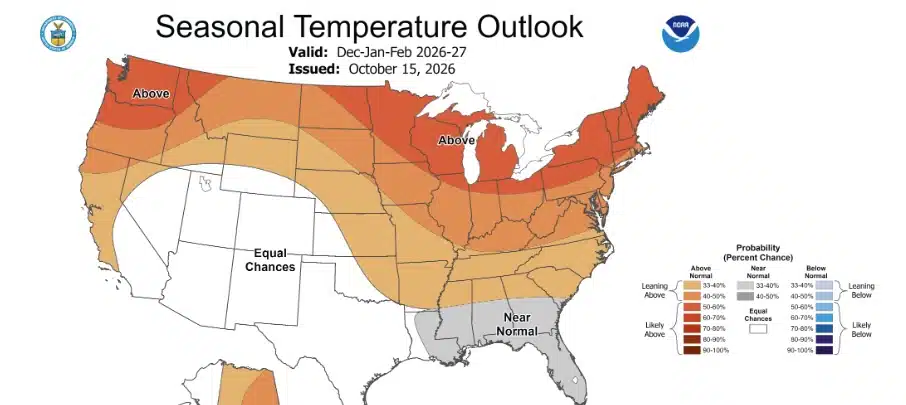
What the temperature colors mean
The orange shading over New York describes the chance that the season's average temperature will fall in the warmest of three historical categories.
The CPC's map explanation divides outcomes into below-normal, near-normal and above-normal categories. Without a favored outcome, each category starts with roughly a one-in-three chance. The current forecast uses 1991–2020 climate normals as its reference period.
For communities around Canandaigua, Seneca and Cayuga lakes, the temperature outlook is a regional seasonal signal, not a prediction of the temperature on any particular morning. A season that averages warmer than normal can still contain freezing weather and cold spells.
Precipitation is a transition, not a statewide answer
The December–February precipitation outlook leaves western New York in the white equal-chances area, while green shading farther east indicates a 33% to 40% chance of above-normal precipitation. The Finger Lakes is near that broad transition; the national map does not support a precise probability for each county or town.
Equal chances does not mean forecasters predict an average amount. It means they are not favoring a wetter, near-normal or drier seasonal total. The relatively light green farther east is a modest shift in the odds, not a confident forecast of a large surplus.
Precipitation and snowfall also measure different things. The seasonal precipitation forecast concerns the accumulated water from precipitation, rather than the depth of snow on the ground or inches of snow falling during a storm.
That matters when reading the national pattern. NOAA's winter outlook favors wetter conditions across the southern United States and along the East Coast, while parts of the Great Lakes have a drier tilt. Those broad descriptions should not be turned into a blanket wetter or drier forecast for New York.
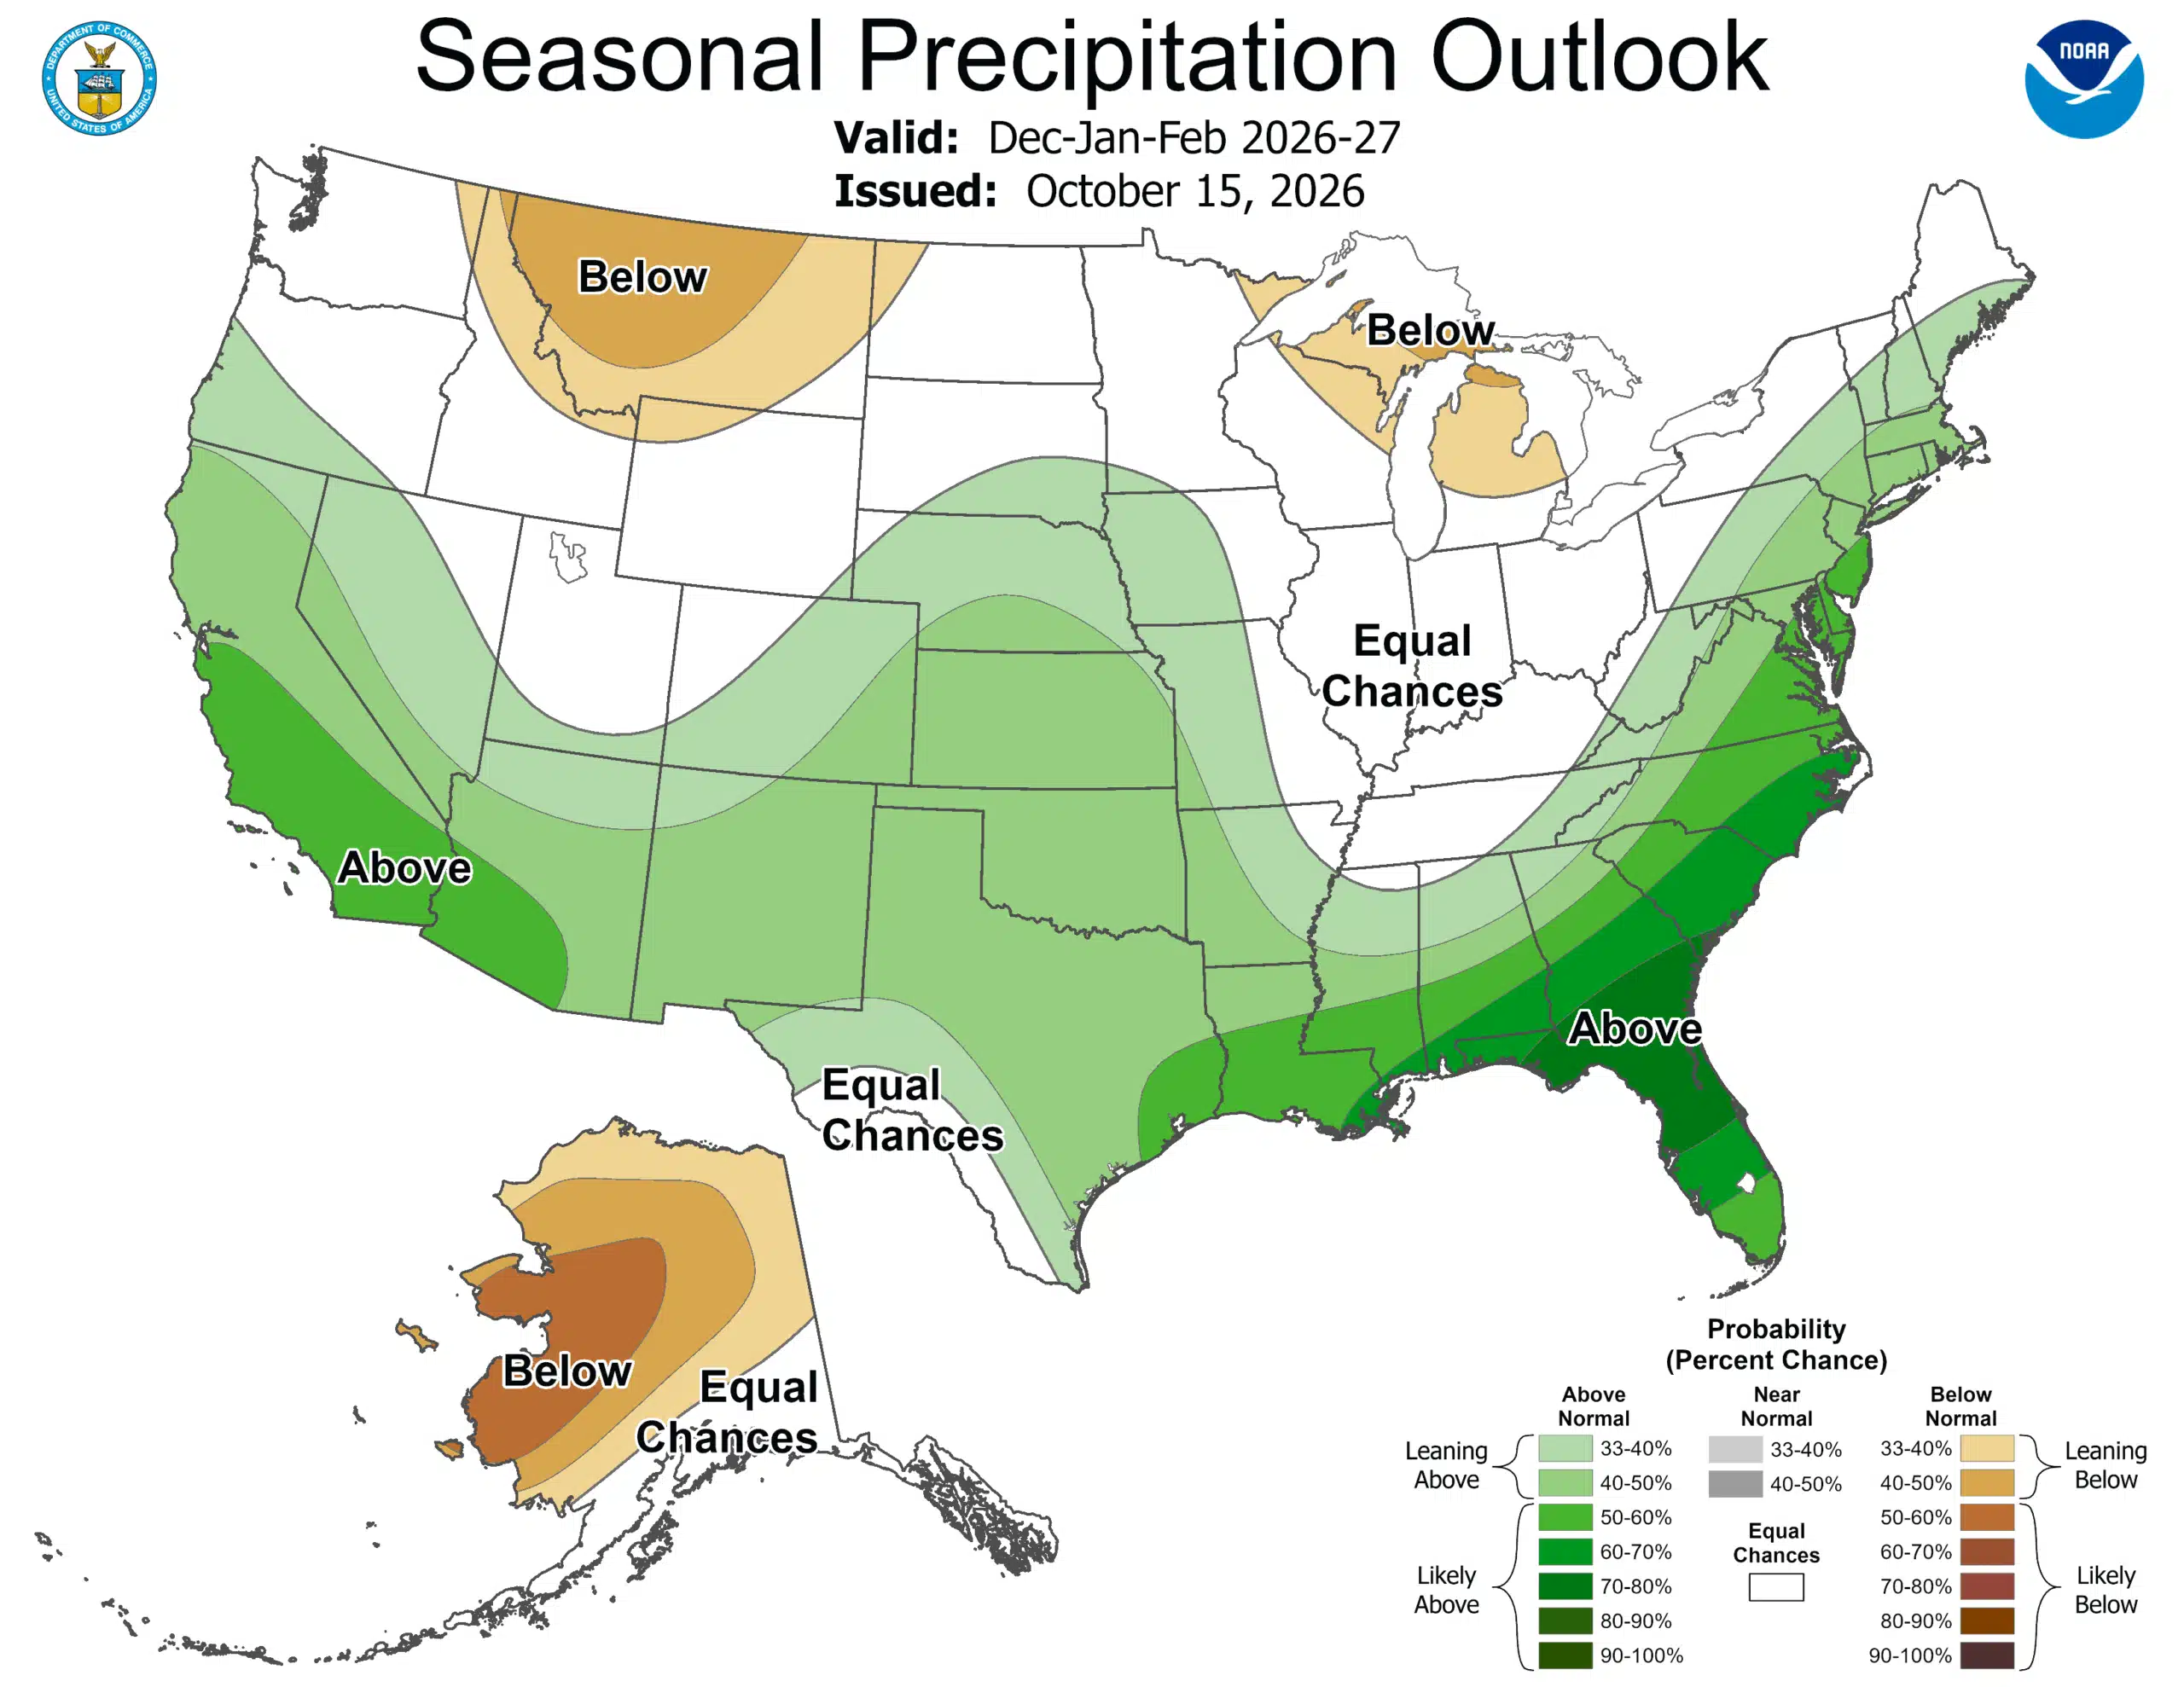
El Niño is driving the larger pattern
In its Oct. 15 forecast discussion, CPC says the ongoing El Niño is strengthening and is a primary influence on the winter and spring outlooks. Forecasters put the chance of at least a strong El Niño continuing through January–March at 80%.
El Niño's influence on the Pacific jet stream helps favor a storm track shifted southward and eastward. CPC also weighs forecast-model ensembles, statistical guidance, historical El Niño winters and longer-term temperature and precipitation trends.
Nationally, the outlook favors warmth across much of the northern country and East, with near-normal temperatures favored in parts of the Southeast. The strongest wet signal is farther south, rather than centered on the Finger Lakes.
The drought forecast answers another question over a different period. NOAA's outlook for Oct. 15 through January anticipates improvement or an end to drought in the Southwest, southern Great Plains, Southeast and parts of the East Coast, while parts of the northern Rockies face development or worsening.
Lake-effect snow still depends on the weather that develops
A warmer seasonal outlook does not settle how much lake-effect snow will fall. NOAA says seasonal outlooks do not project accumulated snowfall, which generally cannot be forecast more than about a week ahead.
The National Weather Service explains that lake-effect snow forms when cold air crosses relatively warm, unfrozen Great Lakes water. Heat and moisture move into the lower atmosphere, allowing clouds and narrow snow bands to develop.
Wind direction helps determine where those bands reach land. Geography matters too, and conditions can change sharply over short distances: heavy snow in one place can occur while an area a mile or two away has sunshine.
For Finger Lakes travel, that means the useful storm information will come from forecasts closer to an event, when meteorologists can assess the cold air, lake conditions and winds together. The seasonal maps cannot identify which community will sit beneath a snow band or how long it will remain there.
New tools will show the range of storm possibilities
NOAA says its Probabilistic Precipitation Portal is operational for this winter, offering low-end, expected and high-end amounts of snow, ice and rain, along with the chance of exceeding specified amounts. The NWS snow and ice resources explain how accumulation ranges complement the standard forecast for an approaching storm.
Those products can show more than a single expected number, helping people understand the range of outcomes as a storm approaches. They serve a different purpose from the three-month outlook.
The weather service has also introduced the ability to use “Particularly Dangerous Situation” wording in selected blizzard and ice storm warnings. The wording is intended for high-confidence events of extreme, historic severity that pose an exceptional threat beyond a typical blizzard or ice storm.
CPC's next seasonal outlook is scheduled for Nov. 19. As winter weather develops, residents can check official local forecasts, watches and warnings for the conditions affecting their community.

FingerLakes1.com is the region’s leading all-digital news publication. The company was founded in 1998 and has been keeping residents informed for more than two decades. Have a lead? Send it to news@fingerlakes1.com.