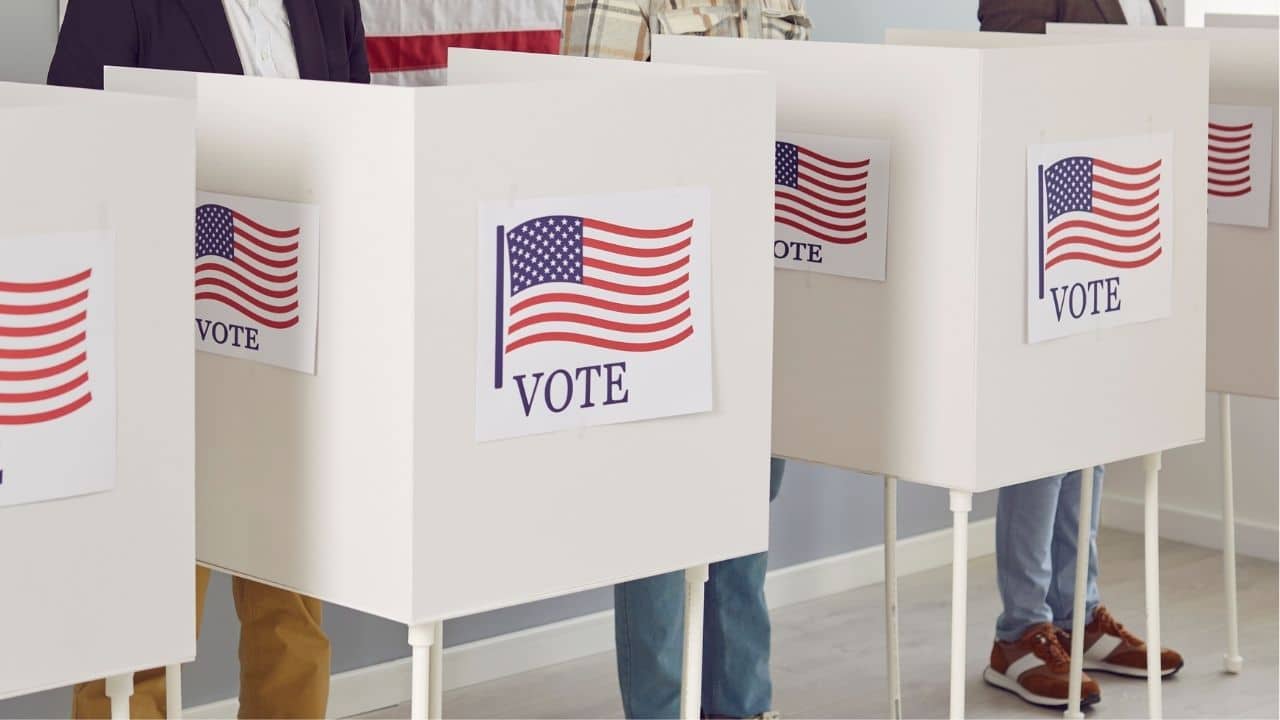
Three-quarters of naturalized citizens eligible to vote speak English and at least one other language, and most have lived in the United States for more than a decade, a Pew Research Center analysis finds.
The national profile drawn from Census Bureau data puts the multilingual share at 76%, compared with 10.2% among U.S.-born eligible voters. Its demographic comparisons use 2024 data.

English is spoken by 96.4% of naturalized eligible voters, close to the 99.9% reported for their U.S.-born counterparts. Among other languages spoken at home, Spanish is most common, followed by Chinese, Hindi and related languages, and Filipino or Tagalog.
Pew’s population is citizens age 18 or older living in the 50 states and the District of Columbia. Naturalized citizens were born outside the country and later gained citizenship. The U.S.-born comparison includes people born in U.S. territories or abroad to American parents. These are measures of eligibility, rather than registration or turnout.
Years in the country help describe the population
Some 73% of naturalized eligible voters had lived in the United States for at least 21 years. Including those here for 11 to 20 years brings the share with at least 11 years of residence to about 92%; 7.7% had lived here for 10 years or less.
The group’s median age was 54, seven years higher than the U.S.-born group’s median of 47. People age 50 and older accounted for 59.8% of naturalized eligible voters and 46.1% of the U.S.-born comparison. At ages 18 to 29, the corresponding shares were 7.5% and 21.5%.
Pew notes that naturalization applicants generally must be lawful permanent residents who have lived in the country for five years, or three years when married to a U.S. citizen.
Mexico was the birthplace of about 15% of naturalized eligible voters. The Philippines supplied 6.4%, India 5.8%, China 4.8% and Vietnam 4.4%. The same countries led in 2022, but the Philippines has overtaken India and China; Pew cites Filipino immigrants’ relatively high naturalization rate.
Two ways to read the racial and ethnic figures
Hispanic adults constitute 33.2% of naturalized eligible voters, Asian adults 32.3%, White adults 20.1% and Black adults 10.7%.
Looking instead within each group’s entire eligible population, naturalized citizens make up 64.7% of Asian eligible voters, about a quarter of Hispanic eligible voters, 9.2% of Black eligible voters and 3.3% of White eligible voters. Asian adults are the only major group whose eligible electorate is mostly naturalized citizens.
Pew uses non-Hispanic, single-race categories for White, Black and Asian adults, while Hispanic adults can be of any race. Other and multiracial responses are outside those four listed groups.
Median family income was $105,000 for naturalized eligible voters and $94,000 for U.S.-born eligible voters. Bachelor’s degrees or higher were held by 39.8% and 34.1%, respectively.
New York State has a larger naturalized share
The national naturalized eligible population grew from about 12 million, or 6.2% of eligible voters, in 2000 to about 25.2 million, or 10.3%, in 2024. Its growth outpaced the overall eligible population.
New York State’s 18.9% share in 2024 ranked behind California at 22% and New Jersey at 19.8%. Florida followed at 17.2%, Hawaii at 15.6% and Nevada at 14.6%. Fourteen states roughly matched or exceeded the national share.
The smallest shares were in Montana at 1.4%, Mississippi at 1.3% and West Virginia at 1.2%. These state figures describe the distribution of eligible voters; the language, age, income and origin profiles above describe the national naturalized population.
Pew analyzed American Community Survey data from 2006 through 2024 and the 2000 census’s 5% sample, accessed through IPUMS at the University of Minnesota. The latest detailed year used in the analysis is 2024.

FingerLakes1.com is the region’s leading all-digital news publication. The company was founded in 1998 and has been keeping residents informed for more than two decades. Have a lead? Send it to news@fingerlakes1.com.