

3 Key Takeaways for New York
- #1 in the Nation, by a Clear Margin: New York records 1,529 rideshare support visits per 100,000 residents, 13.9% above the national average of 1,342 and 7.1% above the second-ranked state, Georgia (1,428).
- High Volume and High Rate — Simultaneously: With 307,702 combined monthly visits, New York ranks 4th nationally by raw volume.
- Uber Dominates New York’s Support Burden: 258,614 of New York’s monthly visits — 83.7% — go to Uber’s help center, at a 5.3-to-1 ratio over Lyft, mirroring the national split but at a far greater scale.
There is a version of New York in which the subway arrives just in time, the cab materializes from nowhere, and the app delivers a ride before the rain starts. But there is another version, lived daily by millions, in which the Uber never appears, the charge does not match the quote, and the help desk becomes the next stop on the commute. Across the five boroughs, the commuter rail corridors, and the upstate cities where rideshare has quietly replaced older modes of getting around, something is consistently going wrong. And when it does, New Yorkers reach for their phones, not to call a driver, but to file a complaint.
The research by Florida-based personal injury lawyer Blakeley Law Firm used Semrush Analytics to measure average monthly traffic to Uber’s support hub (help.uber.com) and Lyft’s support hub (help.lyft.com) across all 50 U.S. states. Combined traffic was normalized per 100,000 residents using 2026 population estimates to rank states from highest to lowest. Nationally, the per-capita rate is 1,342 combined visits per 100,000 residents, with Uber accounting for 83.7% of all support traffic (3,885,688 monthly visits) and Lyft accounting for 16.3% (758,470 monthly visits), a ratio of 5.1:1.
Table 1: New York State Rideshare Support Profile
| Metric | New York |
|---|---|
| National Rank (Per Capita) | #1 of 50 States |
| Population (2026 Est.) | 20,127,000 |
| Combined Monthly Support Visits | 307,702 |
| Per 100,000 Residents | 1,529 |
| Uber Monthly Traffic | 258,614 |
| Lyft Monthly Traffic | 49,088 |
| Uber-to-Lyft Ratio | 5.3 to 1 |
| National Per-Capita Average | 1,342 per 100K |
| NY vs. National Average | +187 visits (+13.9%) |
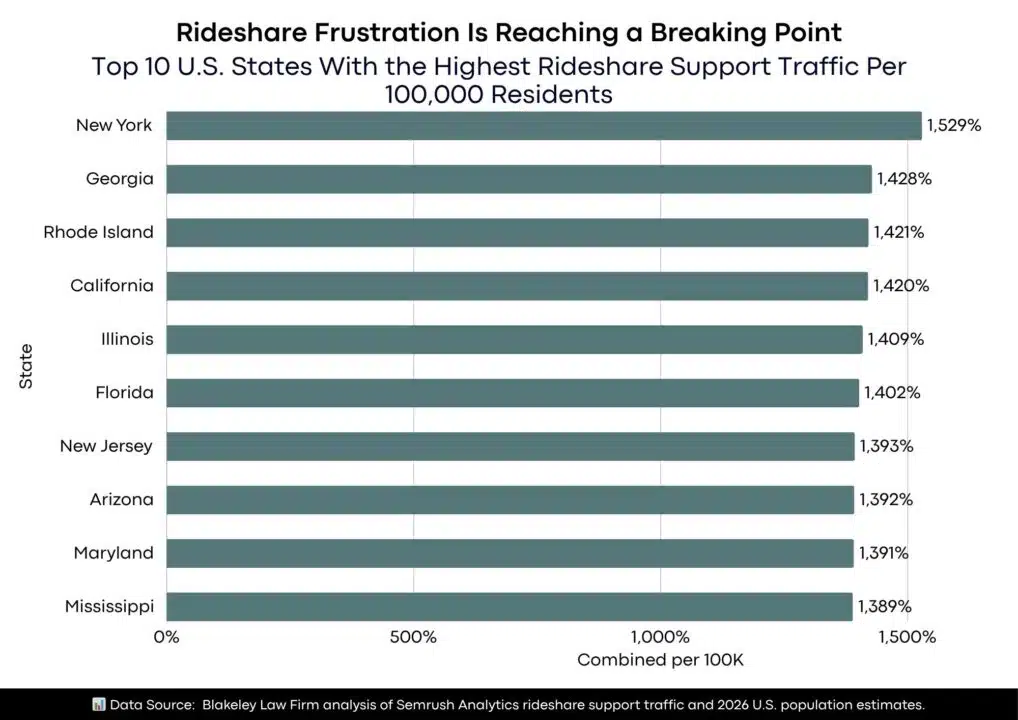
Table 2: Top 10 U.S. States by Rideshare Support Traffic Per 100,000 Residents
| Rank | State | Population (2026) | Combined Average Monthly Page Traffic per 100,000 Residents | Combined Average Monthly Page Traffic | Average Monthly Page Traffic to Uber Customer Support (https://help.uber.com/) | Average Monthly Page Traffic to Lyft Customer Support (https://help.lyft.com) |
|---|---|---|---|---|---|---|
| 1 | New York | 20,127,000 | 1,529 | 307,702 | 258,614 | 49,088 |
| 2 | Georgia | 11,413,800 | 1,428 | 162,959 | 135,679 | 27,280 |
| 3 | Rhode Island | 1,130,070 | 1,421 | 16,060 | 13,915 | 2,145 |
| 4 | California | 39,896,400 | 1,420 | 566,521 | 468,829 | 97,692 |
| 5 | Illinois | 12,846,000 | 1,409 | 181,003 | 152,856 | 28,147 |
| 6 | Florida | 24,306,900 | 1,402 | 340,667 | 284,466 | 56,201 |
| 7 | New Jersey | 9,743,270 | 1,393 | 135,765 | 114,303 | 21,462 |
| 8 | Arizona | 7,801,100 | 1,392 | 108,618 | 91,458 | 17,160 |
| 9 | Maryland | 6,355,540 | 1,391 | 88,387 | 73,248 | 15,139 |
| 10 | Mississippi | 2,942,790 | 1,389 | 40,886 | 34,012 | 6,874 |
| Insight: New York leads the top 10 with a per-capita rate of 1,529, 101 visits above second-place Georgia (1,428) and 140 above the top-10 average of 1,417. Six of the top 10 states sit on the Eastern Seaboard, a pattern that reflects where transit reliance and rideshare dependence are highest. |
Table 3: New York vs. Its Bordering States — Rideshare Support Traffic
| State | National Rank | Combined Average Monthly Page Traffic per 100,000 Residents | Combined Average Monthly Page Traffic | Average Monthly Page Traffic to Uber Customer Support (https://help.uber.com/) | Average Monthly Page Traffic to Lyft Customer Support (https://help.lyft.com) | Gap vs. NY |
|---|---|---|---|---|---|---|
| New York | #1 | 1,529 | 307,702 | 258,614 | 49,088 | — |
| New Jersey | #7 | 1,393 | 135,765 | 114,303 | 21,462 | -136 |
| Pennsylvania | #15 | 1,355 | 178,844 | 150,469 | 28,375 | -174 |
| Massachusetts | #16 | 1,351 | 98,324 | 83,215 | 15,109 | -178 |
| Connecticut | #22 | 1,304 | 48,754 | 40,794 | 7,960 | -225 |
| Vermont | #41 | 1,114 | 7,221 | 6,131 | 1,090 | -415 |
| Insight: Every state bordering New York records a lower per-capita rideshare support rate. The gap is smallest with New Jersey (-136) and widest with Vermont (-415). Even neighboring New Jersey, itself ranked 7th nationally, trails New York by a margin that represents nearly 10.1% of the national average, underlining how much further New York’s friction rate extends. |
Table 4: New York vs. the 10 Lowest-Ranked States — Rideshare Support Traffic
| State | National Rank | Combined Average Monthly Page Traffic per 100,000 Residents | Combined Average Monthly Page Traffic | Average Monthly Page Traffic to Uber Customer Support (https://help.uber.com/) | Average Monthly Page Traffic to Lyft Customer Support (https://help.lyft.com) | Gap vs. NY (Per 100,000) |
|---|---|---|---|---|---|---|
| New York ★ | #1 | 1,529 | 307,702 | 258,614 | 49,088 | — |
| Vermont | #41 | 1,114 | 7,221 | 6,131 | 1,090 | -415 |
| Maine | #42 | 1,105 | 15,648 | 13,038 | 2,610 | -424 |
| New Hampshire | #43 | 1,079 | 15,352 | 12,890 | 2,462 | -450 |
| Delaware | #44 | 1,043 | 11,291 | 9,320 | 1,971 | -486 |
| Wyoming | #45 | 1,033 | 6,123 | 5,150 | 973 | -496 |
| Montana | #46 | 1,032 | 11,863 | 9,760 | 2,103 | -497 |
| Idaho | #47 | 1,018 | 20,992 | 17,725 | 3,267 | -511 |
| Minnesota | #48 | 981 | 57,609 | 48,155 | 9,454 | -548 |
| Alaska | #49 | 953 | 7,121 | 5,965 | 1,156 | -576 |
| South Dakota | #50 | 928 | 8,697 | 7,371 | 1,326 | -601 |
| Insight: New York’s per-capita rate of 1,529 is 64.8% higher than last-place South Dakota (928) and 48.7% above the bottom-10 average of 1,028. The bottom 10 are concentrated in the Mountain West and rural New England, regions with lower population density, fewer rideshare users, and less friction by proportion. New York’s gap over the bottom 10 is not just large; it is structurally different. |
Methodology
This analysis examined average monthly page traffic to Uber’s customer support center (help.uber.com) and Lyft’s customer support center (help.lyft.com) across all 50 U.S. states, using Semrush Analytics to obtain estimated monthly page visit figures by state. Combined average monthly traffic was calculated by summing Uber and Lyft support page visits for each state, and per-capita rates were derived by dividing each state’s combined total by its estimated 2026 population and multiplying by 100,000. States were then ranked from highest to lowest on this per capita basis.
Data Sources
Semrush Analytics (semrush.com): Estimated average monthly page traffic by state for help.uber.com and help.lyft.com.
2026 U.S. State Population Estimates: Used to normalize traffic data across states of varying sizes.
Research Dataset: https://docs.google.com/spreadsheets/d/1s5s984ICTm55SlcmUiji5xIowmPT0_7QVT7uzDX7vLw/edit?gid=0#gid=0
Study by: https://www.floridainjuryadvocate.com/
About Blakeley Law Firm
This study was conducted by Blakeley Law Firm, a Florida-based personal injury practice representing clients who have been injured in motor vehicle accidents or who have lost loved ones due to negligence. floridainjuryadvocate.com
This content is brought to you by the FingerLakes1.com Team. Support our mission by visiting www.patreon.com/fl1 or learn how you send us your local content here.