

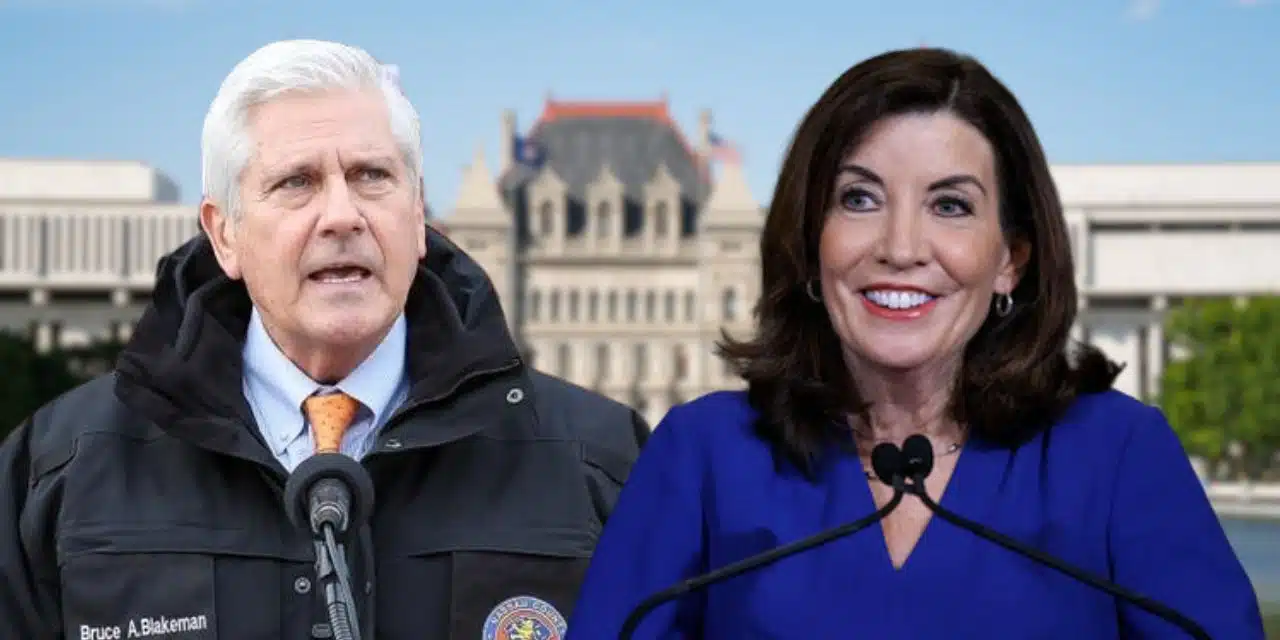
Gov. Kathy Hochul holds a 19-point statewide lead over Republican Bruce Blakeman in a new poll, but upstate New York tells a different story: The candidates are separated by just 3 percentage points.
The Quinnipiac University poll released Sept. 23 found 58% of likely New York voters supporting Hochul and 39% supporting Blakeman, with 3% not choosing a candidate. Among upstate respondents, Blakeman received 49% to Hochul’s 46%.
Cost of living and the economy ranked as voters’ biggest concerns, both statewide and upstate. Yet the poll also found widespread dissatisfaction with New York’s economy, and a separate survey released the same day showed a smaller statewide advantage for Hochul.
Upstate results differ sharply from the statewide numbers
Quinnipiac’s regional breakdown shows Hochul’s strongest support in New York City, where she led Blakeman 70% to 27%. She also led in the poll’s suburban category, 56% to 42%.
Upstate respondents were much more closely divided. They also gave Hochul negative marks for her performance as governor: 40% approved and 52% disapproved, compared with 48% approval and 44% disapproval statewide.
The poll’s detailed results do not provide a separate Finger Lakes estimate. The upstate figures describe a broader region and cannot establish how voters in individual Finger Lakes counties would vote.
The 3-point upstate difference also requires caution. Quinnipiac reports a statewide margin of sampling error of plus or minus 4.1 percentage points, but says subgroup margins are available upon request. The statewide margin should not be applied to the smaller upstate sample.
Living costs lead voters’ concerns
When respondents were asked to choose their most important issue in the governor’s race from a list of 10, 28% selected cost of living, 21% chose the economy and 11% picked health care.
Immigration followed at 9%, taxes at 7%, and crime and affordable housing at 5% each. Energy costs, schools and artificial intelligence data centers each received 3%.
The upstate ranking was similar: Cost of living led at 28%, followed by the economy at 19% and health care at 11%. Taxes and immigration each received 9%.
Those answers measure which issue voters placed first when choosing a governor. A lower ranking does not establish that respondents considered an issue unimportant.
Hochul led statewide on the separate question of which candidate would do a better job lowering living costs, 50% to 38%. She also led on growing the state’s economy, 51% to 41%.
Upstate respondents leaned toward Blakeman on both questions. He received 48% to Hochul’s 42% on lowering living costs and 48% to her 45% on growing the economy.
Party differences were substantial. Among Democrats, 35% selected cost of living as their top issue, followed by the economy at 21% and health care at 16%. Republicans selected cost of living at 21%, immigration at 20%, the economy at 17%, taxes at 15% and crime at 11%. Independents’ top three were cost of living, the economy and health care.
Economic dissatisfaction accompanies Hochul’s lead
The governor’s statewide electoral advantage came despite broadly negative assessments of economic conditions.
Thirty-five percent of respondents described New York’s economy as “not so good,” and 27% called it “poor.” By comparison, 32% rated it good and 2% excellent.
Upstate assessments were more negative: 35% said not so good and another 35% said poor, while 26% said good and 1% excellent.
Asked about how things were going in New York generally, 35% of statewide respondents were very dissatisfied and 19% somewhat dissatisfied. Thirty-nine percent were somewhat satisfied and 6% very satisfied.
Those findings describe voters’ perceptions. They do not measure changes in prices, employment or economic output.
Hochul nevertheless received 66% support among respondents who identified cost of living as their top voting issue, compared with Blakeman’s 30%. Among those choosing the economy, she led 64% to 34%.
Blakeman supporters report greater enthusiasm
Quinnipiac found strong support for each candidate within their own party. Hochul led among Democrats 89% to 6%, while Blakeman led among Republicans 90% to 8%. Independents favored Hochul 51% to 45%.
Hochul led among women 63% to 34% and among men 52% to 44%.
Blakeman’s supporters, however, were more likely to describe themselves as very enthusiastic about their candidate: 51% did so, compared with 29% of Hochul supporters. Another 51% of Hochul supporters and 37% of Blakeman supporters were somewhat enthusiastic.
Most respondents who selected a candidate said they were unlikely to switch. Seventy-nine percent said they were not likely at all to change their choice before the election.
Blakeman also remained less familiar to voters. Thirty-four percent said they had not heard enough about him to form an opinion, compared with 10% for Hochul. His statewide favorability rating was 30% favorable and 36% unfavorable; hers was 46% favorable and 43% unfavorable.
On personal qualities, 48% said Hochul had good leadership skills and 48% said she cared about people like them. Blakeman received 34% and 35%, respectively. Forty-five percent described Hochul as honest, compared with 32% for Blakeman.
These were respondents’ assessments of the candidates, rather than independent findings about their character.
Another poll shows a smaller Hochul advantage
A Siena Research Institute poll also released Sept. 23 put Hochul ahead of Nassau County Executive Blakeman 50% to 41%, a 9-point statewide lead. Siena’s upstate results were Blakeman 47%, Hochul 44%.
Siena interviewed voters Sept. 11-17, while Quinnipiac’s interviews ran Sept. 17-20. Siena used telephone and text-to-web responses; Quinnipiac used live telephone interviews.
Both found Hochul ahead statewide and a close upstate contest, but differed substantially on the size of her statewide advantage. Because they surveyed different samples using different methods and field dates, the results alone do not establish that her lead grew by 10 points between surveys.
Siena’s core sample included 1,144 likely voters, with a margin of sampling error of plus or minus 3.9 percentage points.
Schumer and Trump receive negative ratings
The Quinnipiac survey also found weak ratings for Sen. Chuck Schumer in his home state. Thirty-six percent approved of his job performance and 54% disapproved. Among Democrats, 56% approved and 33% disapproved.
Sen. Kirsten Gillibrand received 41% approval and 33% disapproval, with 26% not offering an opinion.
President Donald Trump’s job approval stood at 29%, while 66% disapproved. Upstate, 34% approved and 61% disapproved.
On favorability, Schumer received 34% favorable and 51% unfavorable. Rep. Alexandria Ocasio-Cortez received 41% favorable and 36% unfavorable, while Zohran Mamdani received 46% favorable and 36% unfavorable.
The Democratic Socialists of America received 29% favorable and 43% unfavorable. Trump’s Make America Great Again movement received 29% favorable and 62% unfavorable.
These questions measured opinions of officials and political groups. They were not a head-to-head test of a potential Senate race.
How the poll was conducted, and when New Yorkers vote
Quinnipiac surveyed 1,026 likely New York voters Sept. 17-20. Its sample and methodology statement reports live interviews in English or Spanish using randomly generated landline and cellphone numbers.
The survey was funded entirely by Quinnipiac University. Its weighting included demographic characteristics, party identification benchmarks from recent Quinnipiac polls and 2024 presidential election results.
The statewide margin of sampling error was plus or minus 4.1 percentage points, including the design effect. Sampling error is only one potential source of polling error, and the results represent opinion during the interview period rather than a prediction of the final vote. The governor’s ballot question included voters leaning toward a candidate.
New York’s general election is Nov. 3, with polls open from 6 a.m. to 9 p.m., according to the state Board of Elections. Early voting runs Oct. 24 through Nov. 1, with hours and locations available from county boards of elections.
FingerLakes1.com is the region’s leading all-digital news publication. The company was founded in 1998 and has been keeping residents informed for more than two decades. Have a lead? Send it to news@fingerlakes1.com.