
A colored dot on Cornell University's Finger Lakes PFAS map can show residents where students sampled water and what they found. Viewed alongside nearby sampling locations and potential pollution sources, those results can help communities decide where closer monitoring could be useful.
The FLX PFAS Project's public map brings together measurements from lakes, tributaries, ponds and places where rainwater persistently collects. Its purpose is to help explain how per- and polyfluoroalkyl substances, the persistent chemicals known as PFAS, move through the local environment.

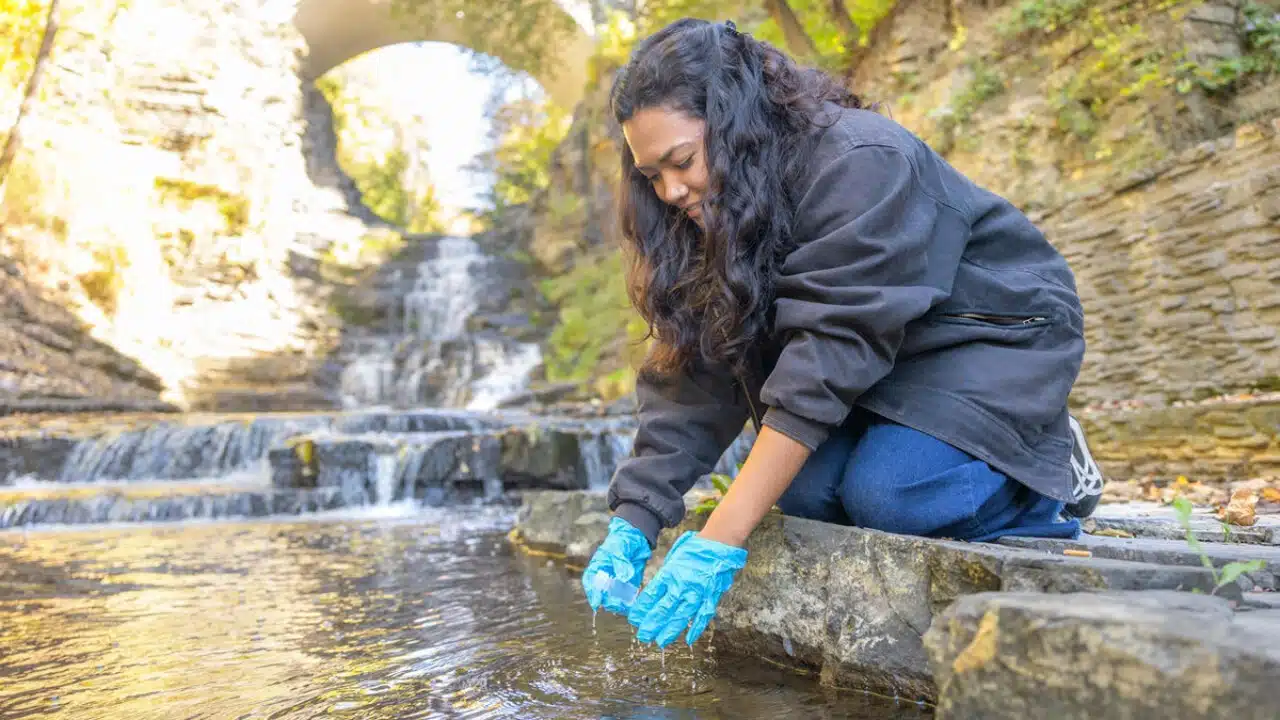
The student sampling project has produced more than 500 samples from 300 bodies of water, including all 11 Finger Lakes. The team screened those samples for 24 common PFAS, according to an Oct. 15 Cornell Chronicle report.
The map is a record of surface-water sampling.
Start with the sample points
The map shows the students' samples as colored circles. Clicking a point opens a pop-up with more information about that location. The project labels concentrations in nanograms per liter, abbreviated ng/L, or parts per trillion, abbreviated ppt.
The map also includes supplementary layers showing airports, fire stations and other facilities considered potential PFAS sources. Users can turn those layers on or off using the sidebar on the right and click their points for additional information.
Those layers serve a different purpose from the sampling circles: They put measured water results in geographic context. A facility marker identifies a potential source to examine alongside the water data, rather than establishing that a particular facility caused a particular result.
The researchers' broader work includes developing ways to identify sources by the mix of PFAS present. Undergraduates meet weekly with Professor Damian Helbling and graduate students studying that chemical fingerprinting, how PFAS change in the environment, and ways to capture and destroy them.
Look at the setting as well as the reading
The sampling covers large lakes and small bodies of standing water. That range matters when interpreting the regional picture.
Cornell reported relatively low PFAS concentrations overall in the Finger Lakes. Higher readings, including some above New York state guidance values, occurred largely in standing water near airports and fire-training stations.
According to the researchers' account, aircraft de-icing fluids and firefighting foams appear to contribute to spikes at those sites, with concentrations declining over time. Cornell said the higher-reading locations were not drinking-water sources and were often isolated from other waterways.
The team thinks the region's large volume of surface water helps dilute PFAS. That explanation concerns the broad pattern in the samples; the local setting still matters when deciding which locations warrant further attention.
Gregory Pepin, a civil engineering student, said the elevated sites could help researchers improve monitoring and source control. Identifying places that need closer investigation is one use of a map that shows both measurements and nearby potential sources.
Use drinking-water results for drinking-water questions
Surface-water results describe the water collected at the sampling location. A drinking-water question concerns the water supplied for consumption, which calls for information about that supply.
The New York State Department of Health's annual water quality report guidance directs residents to their public water supplier, local health department or state health district office for reports that are not available through its online listings. Those reports explain the supply's source and water quality.
That gives residents two complementary ways to learn about local water: Cornell's map for the environmental sampling record and the supplier's results for their public drinking-water system. The project's screening of 24 selected PFAS is also narrower than testing for the entire class of chemicals.
Why repeat sampling could be the map's lasting value
The first samples were taken in 2024, after Helbling received questions from residents in 2023 about PFAS in nearby waterways. Alex Van Den Hende built the public-facing map before sampling began, and the team has continued improving it as the dataset grew.
Helbling, a civil and environmental engineering professor in Cornell's Duffield College of Engineering, said the combination of many sampling locations and measurements over time gives the project unusual breadth compared with regional monitoring based on fewer samples collected at long intervals.
Those measurements create a baseline for future comparisons. Researchers could compare later samples with the existing record as industries establish themselves in the region, helping them examine changes rather than relying on a single regional snapshot.
The students also hope to use what they have learned to help identify high-priority monitoring areas elsewhere in New York and inform state PFAS monitoring. The team is now in its second generation as new students continue the work of members who have graduated.
How the information is reaching communities
Public communication has been part of the project from the start. The team has presented the work at nearly a dozen conferences and meetings of watershed groups and municipal organizations, working with the Cornell-based New York State Water Resources Institute. Brune Boukobza initially led that outreach.
Chemical engineering student Madeline Adams and Pepin said the project's local purpose has strengthened their interest in working with communities. Van Den Hende, now an environmental engineer with the Federal Energy Regulatory Commission in Washington, D.C., also described the opportunity to answer residents' questions as a motivation for joining the project.
The water resources institute and the state Department of Environmental Conservation have funded the work. The team plans to keep using its accumulated data to develop new questions and identify places where more monitoring could provide useful answers.

FingerLakes1.com is the region’s leading all-digital news publication. The company was founded in 1998 and has been keeping residents informed for more than two decades. Have a lead? Send it to news@fingerlakes1.com.