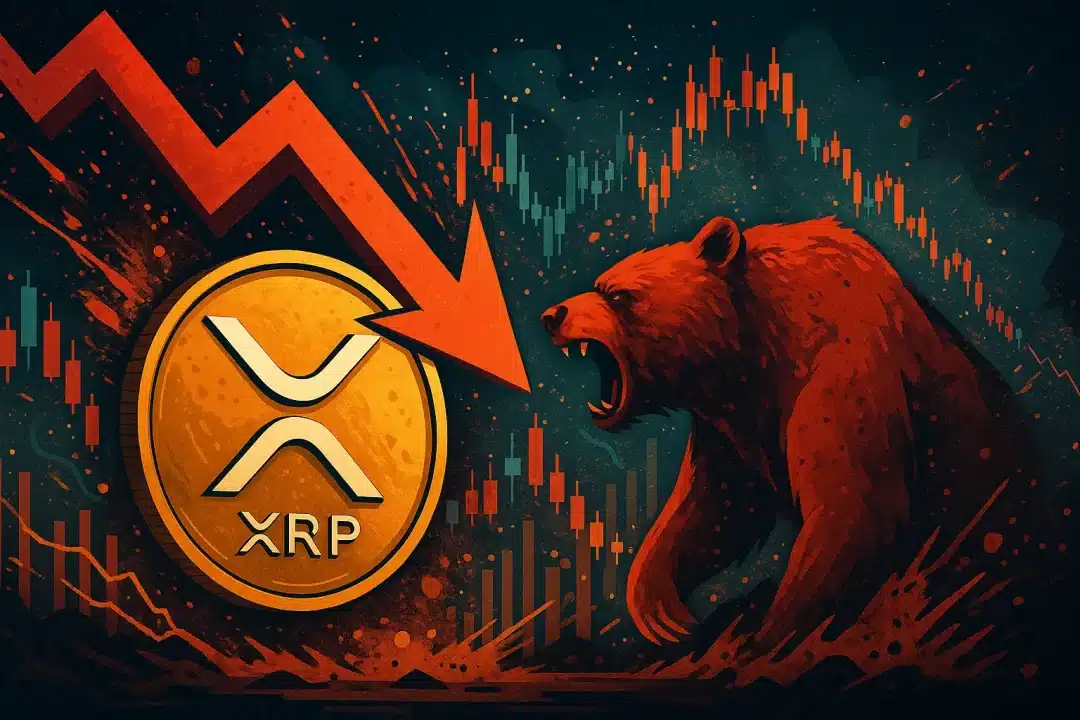
The XRP price is teetering near a critical support level as fresh technical and onchain indicators point to heightened downside risk in early June 2025.
XRP breaks below key pattern — Is $1.70 next?
XRP is currently trading around $2.13, down 18% from its May peak of $2.65. A newly formed inverted V-shaped pattern on the daily chart hints at a possible 20% drop toward the $1.70 demand zone.
- The RSI (Relative Strength Index) has declined from 68 to 41 since mid-May, suggesting increasing bearish pressure.
- The price has broken below its rising channel, with three consecutive daily closes beneath the lower trendline.
- Analysts warn that unless momentum shifts, XRP could dip to $1.72 or lower.
“It looks like XRPUSDT can recover any minute now, but the bearish momentum continues to grow,” said TradingView analyst MasterAnanda.
Weekly RSI divergence signals weakening trend
A bearish divergence has emerged on XRP’s weekly chart:
- Price action has formed higher lows from late 2024 to mid-2025.
- Meanwhile, weekly RSI has trended lower, from 92 to 51.
- This mismatch historically signals a fading uptrend, often followed by corrections as buying interest wanes.
With resistance near $2.50–$2.65 holding firm, XRP could continue facing rejection at higher levels.
XRP Ledger activity plunges
Network usage across the XRP Ledger has plummeted over the last two months:

- Daily Active Addresses (DAA) are down from a March peak of 608,000 to just 31,200.
- New addresses have dropped more than 70%, from 15,800 to 4,400.
These declines indicate waning user interest and reduced liquidity — both of which often precede sharp price corrections.
Onchain data suggests a “denial” phase among long-term holders — a psychological phase that has previously signaled local tops.
Key downside targets: $1.70, $1.25, or even $1.06?
Two potential lower targets are now on analysts’ radar:
- $1.70: neckline of the inverted V pattern and major support zone.
- $1.25: projected from a descending triangle breakdown seen in late May.
- $1.06: XRP’s realized price — the average cost basis onchain — where previous corrections have bottomed out.
Meanwhile, some ultra-bullish speculators point to a long-term target of $27 if XRP’s market cap were to hit $1.5 trillion, though such forecasts remain highly speculative.
What happens next?
Traders will closely watch for:
- Any bounce from the $1.70 zone
- RSI trend reversals
- Onchain metrics showing renewed network activity
Without these signals, XRP may continue its downward path in June 2025.

This content is brought to you by the FingerLakes1.com Team. Support our mission by visiting www.patreon.com/fl1 or learn how you send us your local content here.